Interactive data story · Research report · Development analytics · 2026
Who Benefits? Health, Jobs & Gender in the World Bank Group Portfolio
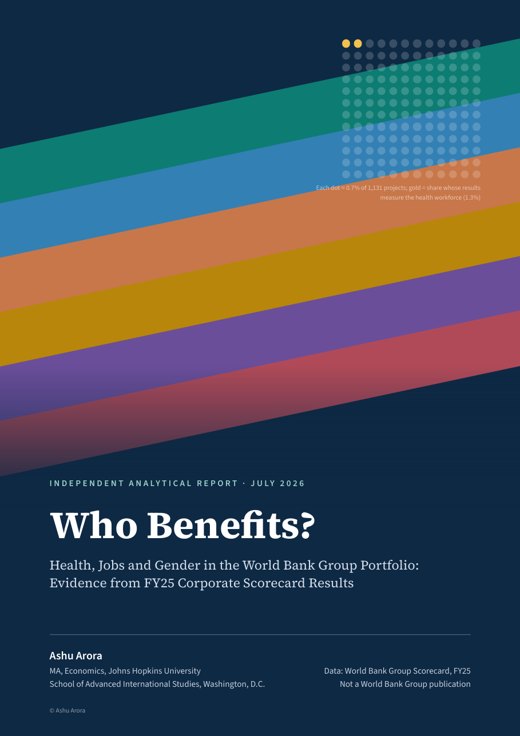
An independent analysis of the World Bank Group's own FY25 corporate results: 1,131 projects in 125 countries. It asks three questions. Who is being reached? Does the portfolio measure the link between health, jobs and labour mobility? Do projects deliver to women as planned, and is the gap wider in fragile and conflict-affected settings?
Methods include rule-based text classification with hand-checked precision, a cross-validated early-warning model with fairness checks by region and fragility, and propensity-score matching with regression robustness checks. All of it runs in one reproducible Python pipeline, and the limitations are documented alongside the results.
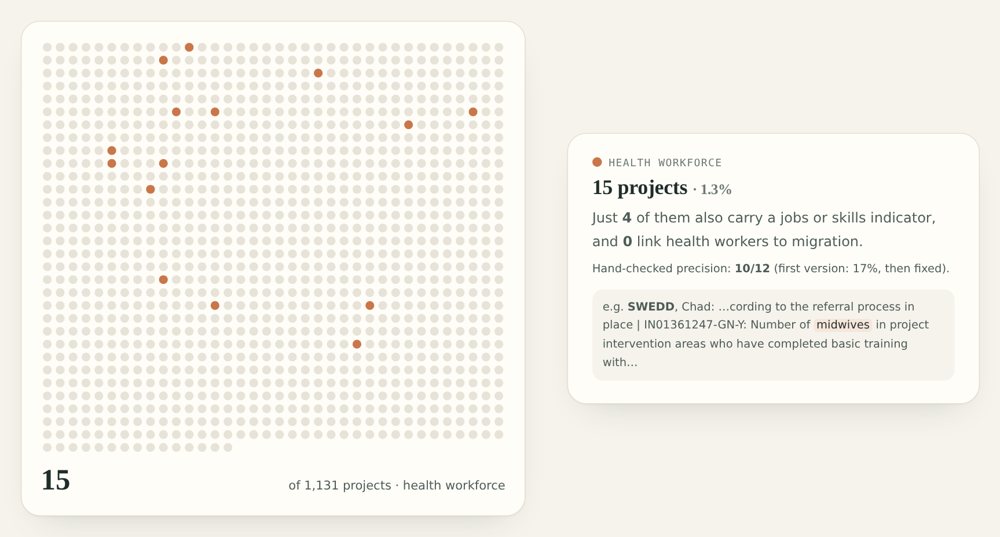
- 15 of 1,131 projects report an indicator about health workers, and none links them to migration.
- 22% of results reported for women use a fixed share of the total, not a direct count.
- No detectable fragility penalty in the gender delivery gap (−1.3 pp, 95% CI −8.7 to +6.8).
Interactive dashboard · Working paper · Data science · 2026
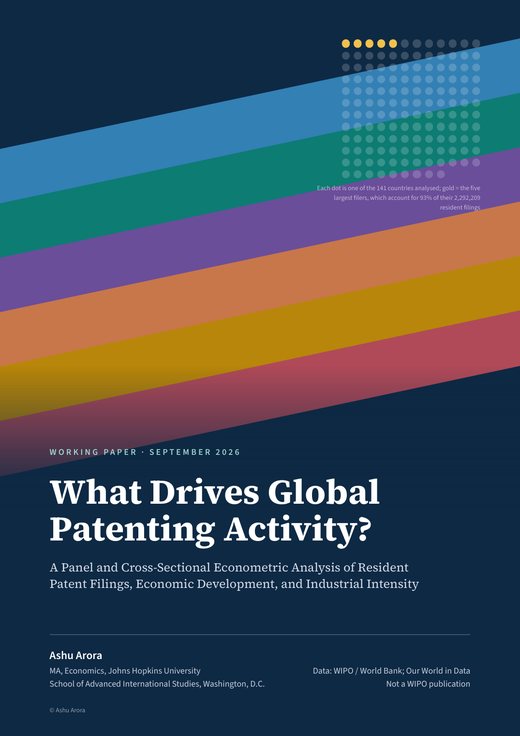
What Drives Global Patenting Activity?
An econometric and machine-learning study of what predicts how many patents a country files, and which countries file more or fewer than expected. It matches WIPO resident patent filings from 141 countries with GDP, population and energy-use data.
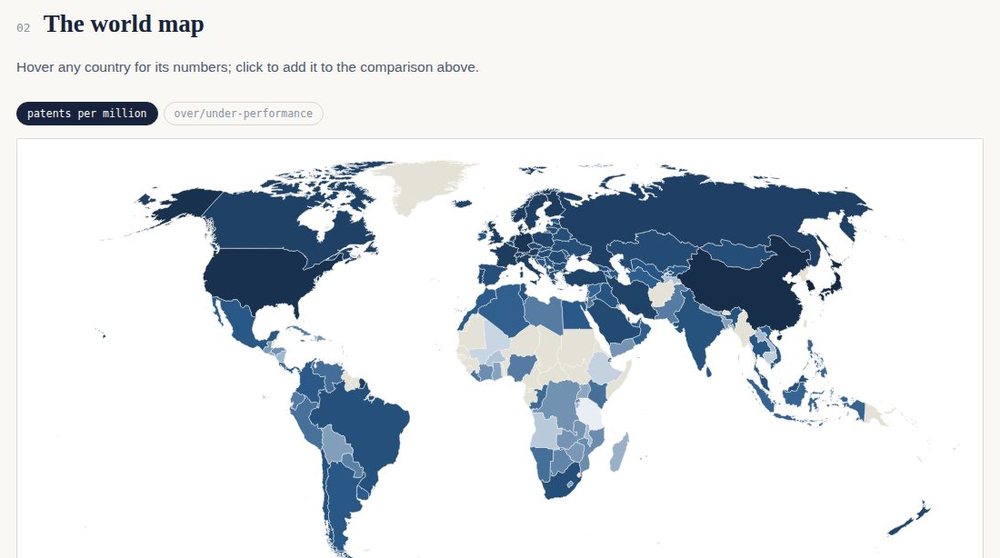
The dashboard lets you compare countries and regions, explore a world map of over- and under-performers, and build a hypothetical country to see what the fitted model predicts. The working paper sets out the methods and results: OLS, panel fixed effects (2,201 observations, 136 countries, 2000–2021), a Negative Binomial count model, and Gradient Boosting and Random Forest with country-grouped cross-validation.
- 73% of cross-country variation in log patent filings is explained by GDP per capita, population and energy use (R² = 0.733).
- 0.51 → 0.02: the GDP-per-capita elasticity disappears once country and year fixed effects are added (p = 0.96).
- Korea, Japan and China file substantially more than fundamentals predict.
Interactive tool · User guide · Health economics data · 2026
Health Economics Data Finder
A curated catalogue of evaluation-ready health data for India, with global comparators. Each dataset is tagged by structure (panel, repeated cross-section, administrative), the finest geography it supports, the research designs it can serve, its access conditions and its comparability traps.
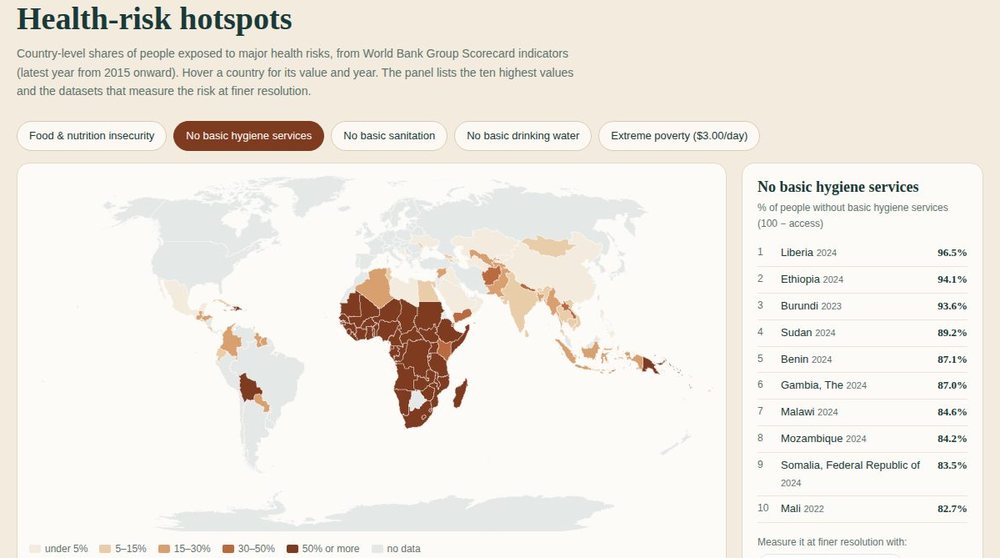
A guided search ranks datasets for a chosen theme, geography and design and explains why each one matched. A side-by-side table compares them, and a hotspot map shows health-risk exposure by country from World Bank Group Scorecard data. Every entry is marked checked (with the source used) or to verify. The companion guide explains how to use it and adds four short issue briefs.
 Full report · PDF · July 2026